
Here is how to calculate engagement rate on Instagram: add up the likes, comments, saves, and shares a post got, divide that total by your follower count or by the post's reach, and multiply by 100. The result is a percentage, your engagement rate, and it is most useful for comparing your own posts with each other. The number you divide by changes the result, as the example further down shows.
What is engagement rate on Instagram?
Engagement rate on Instagram measures how many people did something with your post beyond seeing it: liked it, commented, saved it for later, or sent it to someone. Seeing the post doesn't count, only the reaction.
Meta, the company that owns Instagram, has a metric for this in its developer documentation called total interactions: the post's likes, saves, comments, and shares, minus unlikes, unsaves, and deleted comments. It is the safest base for the math, because it is the number Meta gives the tools that connect to Instagram.
Each interaction says something different about how the person felt about the post:
- Like: the quickest reaction, one tap.
- Comment: the person stopped to write something.
- Save: the person wants to come back to the post later.
- Share: the person sent the post to someone or added it to their story. This is what takes your profile to people who don't follow you yet.
Reach and engagement measure different things. Reach counts how many accounts saw the post at least once, and engagement counts how many of them reacted. A post can reach a lot of people and get very few interactions, and the opposite happens too.
How do you calculate engagement rate on Instagram?
Instagram engagement rate is a division: the post's interactions divided by a reference number, with the result multiplied by 100. What changes from one formula to another is that reference number, which can be your total followers, the post's reach, or its views.
| Formula | Math | When to use it |
|---|---|---|
| By followers | interactions ÷ followers × 100 | To compare your profile with others and with the Quid benchmark further down, since any account's follower count is public. |
| By reach | interactions ÷ reach × 100 | To see how the post did with the people who actually saw it, followers or not. |
| By views | interactions ÷ views × 100 | For Reels and videos, where the same person can watch the post several times. |
To calculate the engagement rate of one of your posts:
- Wait two days after posting. The numbers from the first hours are still moving.
- Open the post's insights and write down likes, comments, saves, shares, reach, and views.
- Add up the four interactions.
- Divide the total by followers, reach, or views, depending on the formula you chose.
- Multiply by 100 and log the percentage in a spreadsheet, with the date, the format (carousel, Reel, or photo), and the formula you used.
For the engagement rate of your whole profile, not just one post, calculate the rate for your latest posts (the last ten, for example) and take the average. That way the result doesn't hinge on a single post.
Impressions no longer work for this math on new posts. According to the same Meta documentation, the impressions metric isn't available for posts created after July 2, 2024. If a calculator or an old spreadsheet asks for impressions, use views, which are still on Meta's list of metrics.
Why does the same post give three different rates?
The same post gives three different rates because each formula divides by a different number. To see it in practice, take this made-up example with round numbers: a hair salon with 1,800 followers posts a carousel on how to keep hair color from fading between appointments.
- 72 likes, 9 comments, 15 saves, and 12 shares: 108 interactions.
- A reach of 2,700 accounts, more than the follower count, because the carousel also reached people who didn't follow the salon.
- 4,320 views, because some of those people saw the post more than once.
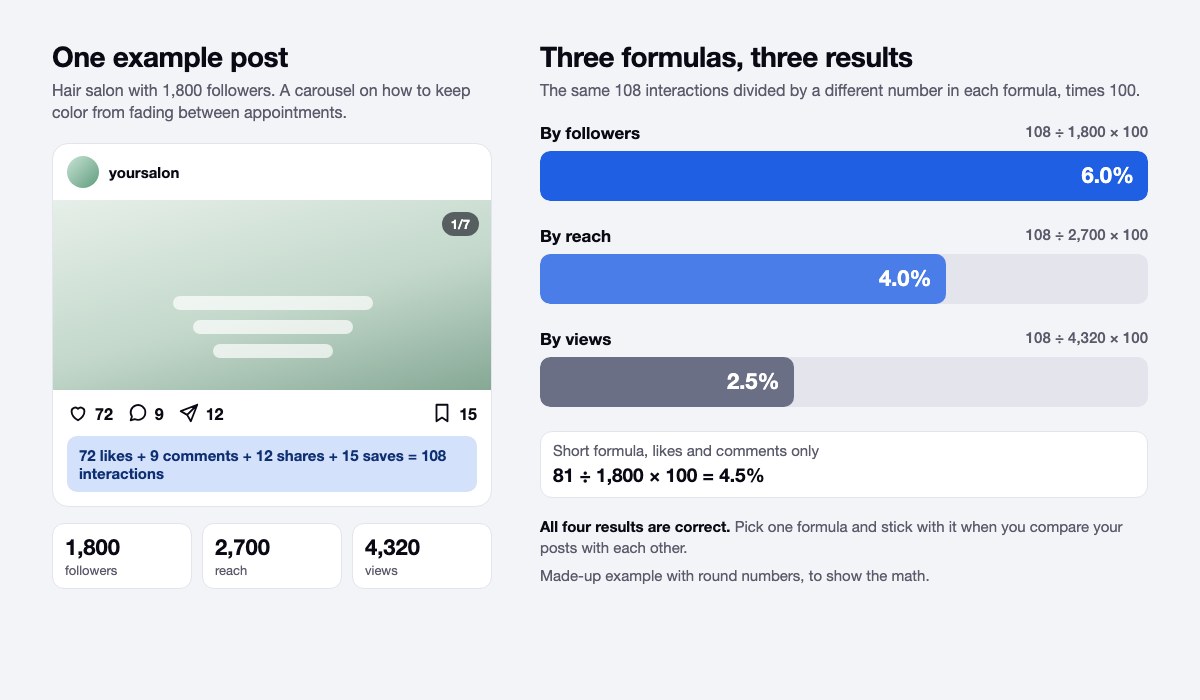
With these numbers, the rate by followers is 6.0% (108 ÷ 1,800 × 100), the rate by reach is 4.0% (108 ÷ 2,700 × 100), and the rate by views is 2.5% (108 ÷ 4,320 × 100). The short formula, which only adds likes and comments, gives 4.5% (81 ÷ 1,800 × 100). That's four correct results for the same post.
What matters is using the same formula every time. If you measure by followers in March and by reach in April, you'll see a drop that never happened. Pick one, write it next to the number, and compare each new post only with the ones you measured the same way.
The example also shows a detail that can be confusing. When a post reaches more people than your total followers, the rate by reach comes out lower than the rate by followers, because you're dividing the same interactions by a bigger number. That's what happened with the salon's carousel, and the post didn't do any worse because of it.
How do I see my engagement rate?
The numbers you need are in each post's insights, inside the Instagram app: the post's interactions and its reach. From there, the rate is the division from the table above.
Outside tools that connect to your account read this data through Meta's API (the official connection to Instagram), which only works with Instagram professional accounts, business or creator. Meta's documentation includes two notes that help you avoid getting the math wrong:
- Data can be delayed up to 48 hours. If you calculate engagement the same afternoon you posted, the number may be incomplete.
- Paid results are left out. The likes, comments, views, and total interactions the API returns are organic only, so whatever the post got as an ad isn't counted. If you boosted the post, the rate doesn't include what came from the ad.
Free engagement rate calculators that only ask for a username don't have your reach or your saves, which only the account owner can see. So they calculate by followers, using the likes and comments that are public. That's enough to check a competitor's or a partner's profile. For your own profile, the math done with your own numbers is more complete, because it includes saves, shares, and reach.
A simple spreadsheet does the job: one row per post, with the date, format, topic, the four interactions, reach, views, and the rate by reach. After a month of filling it in, sort it by rate and see which topics and formats end up on top.
What is a good engagement rate on Instagram?
A good engagement rate on Instagram is one that beats your own previous number, measured with the same formula. Industry benchmarks give you a rough idea, but each one uses its own method, and comparing your number with one calculated a different way leads to the wrong conclusions.
A well-known benchmark is the annual social media report by industry from Quid, which used to come out under the Rival IQ name (Rival IQ is now part of Quid). In the 2026 edition, published in March, the median Instagram engagement rate across all industries fell from 0.36% to 0.30%. That number is calculated by dividing interactions by followers, using 150 companies picked at random from each of the study's 18 industries, out of a database of more than 200,000 companies.
So it doesn't make sense to put the salon's 6.0% next to that 0.30%: the example is made up, and Quid's benchmark measures a different group of accounts. What the report does show is which way the number moves from one year to the next, always with the same method.
For your own profile, the most useful benchmark is your own posts. Write down the rate of your last ten posts, sort them from lowest to highest, and take the average of the fifth and sixth: that's your median. A new post above that number did better than usual on your profile, and its topic or format is worth repeating.
Your rate by followers can also drop without anything getting worse. If you gain a lot of followers in a month and interactions stay the same, the number you divide by has grown, so the percentage falls. In that case, check the rate by reach before changing what you post.
Which interactions matter most to Instagram?
For Instagram, not all interactions count the same when it decides whether to show your post to more people. In January 2025, Adam Mosseri, the head of Instagram, said the three signals that matter most for ranking posts are watch time, likes, and sends (when someone shares the post in a direct message). His comments are summarized by Social Media Today, which also includes his advice to look at likes per reach and sends per reach.
Mosseri also said sends carry a bit more weight with people who don't follow you, and likes a bit more with people who already do. For a business that wants new clients, that points to posts someone would want to send to another person, like a useful list or the answer to a question clients often ask.
About the feed, Instagram published a post signed by Mosseri in 2023 explaining how it ranks what you see. In the feed, the five interactions it looks at most are how likely you are to spend a few seconds on the post, comment on it, like it, share it, and tap the profile photo of whoever posted it. Saves aren't on that list, but they are part of Meta's total interactions, so they count toward your rate.
If you only want to track one formula, the rate by reach is the closest to what Mosseri himself recommended looking at, because it divides by the people who actually saw the post.
How to improve engagement on a business profile
To improve engagement on a business profile, measure the same way every week and change one thing at a time. That way you know which change moved the number. A few tests you can run:
- Post regularly. With only a few posts there's nothing to compare, and you won't find out what worked. For a posting rhythm, see how often to post on Instagram to grow.
- Make posts people want to send to someone. A list of common mistakes, a price explained, or a "save this for your next appointment." Then compare their saves and shares with your other posts.
- End with a question that's easy to answer. "Which of the three would you try first?" can be answered with a number. "What do you think?" takes more work from the reader.
- Reply to comments. A reply from you gives the person a reason to come back to the post and keep the conversation going.
- Try a different posting time for two weeks and compare the rate by reach with the two weeks before. There are timing suggestions in the best time to post on Instagram.
If your profile is a service business like the one in the example, there are topics ready to test in what to post on Instagram as a hairdresser.
If what dropped was your reach and the rate by reach stayed the same, the people who see your posts are reacting as before and the problem is elsewhere. For that case, read why your Instagram reach dropped. And if what you're missing is things to post, start with what to post when you run out of ideas.
ZapPost delivers the carousel, the Reels script and the caption ready to go. No writing prompts, no Canva, no new tool to learn. You review and publish.
Frequently asked questions
Is a 4.2% engagement rate good?
It depends on the formula. If it's by followers, 4.2% is higher than the 0.30% median in Quid's 2026 report, which uses the same division, but that median comes from a different group of accounts. The comparison that tells you the most is with your own median: if your last ten posts sit around 3%, a 4.2% post did better than usual.
Can you calculate another account's engagement rate?
Yes, but only by followers and with what is public: the likes and comments on their posts divided by their followers. Only the account owner sees reach and saves, and if the profile hides like counts, the math is even less complete.
Why did my engagement rate drop?
First check that you're using the same formula as before and that you waited two days to measure. Then see whether your followers grew a lot in that period, which pulls down the rate by followers even with the same interactions. If the rate by reach dropped too, try a different topic, format, or posting time.